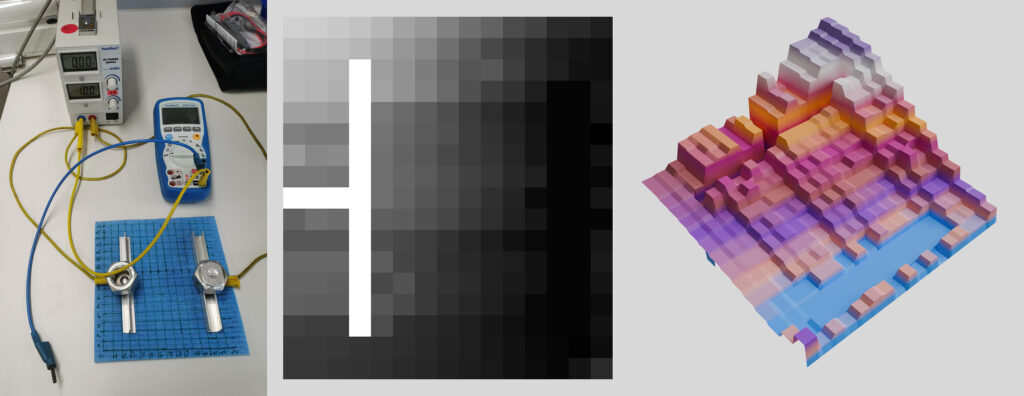
Objective: The goal is to visualize a magnetic or force field as a three-dimensional object in high school (German ‘Gymnasium’) physics classes. For this purpose, students will conduct an experiment, such as measuring the magnetic field of a magnet or the force field of a capacitor in a two-dimensional coordinate system. The measured values will be recorded along with the coordinates in a CSV file or a text document. From these rather ‘inapproachable’ notes, a grayscale image will then be generated, which can be converted into a 3D model or a tactile 3D print using a displacement map. For this purpose I developed a tool for this process, referred to as the ‘Data Plotter’, that fulfills exactly this function: Coverting measured data values into a greyscale image. Initially started as a relatively small project between a friend of mine that teaches physics in Munich and myself, the tool has since grown into quite a comprehensive utility. Below, I outline the tool’s requirements and the solutions implemented to meet them.
Challenges and Solutions
Possible Software Restrictions on School Computers: School computers often cannot be easily equipped with generic software, ruling out a standalone executable file. Installing custom software might be prohibited. Solution: A simple HTML webpage utilizing JavaScript, compatible with any modern browser. The only requirement is that JavaScript must be enabled.
Specific Requirements: The tool needs to be as lightweight as possible, with no tracking, cookies, or unnecessary features. Solution: Pure HTML, JavaScript, and minimal CSS are employed. The entire tool (the webpage) is less than 25 kB in size, ensuring quick loading even on unstable connections. To keep HTTPS requests minimal, no external libraries, frameworks, or CMS systems are included. Additionally, the tool does not require any special server-side infrastructure (e.g., PHP, Perl, or CGI scripts). All functions are bundled into a single HTML file that can even run off a USB stick without an internet connection. This makes the tool easy to share among colleagues or distribute via email.
Compatibility with Various and Older Devices: To ensure flexible usage in classroom settings, the tool must work both on a 4K projector and a smartphone screen. Solution: Minimal use of CSS, following the principles of the “motherfuckingwebsite” approach, which ensures native responsiveness through basic HTML structures.
Open Educational Resource (OER) Sharing: The tool must be shareable as an Open Educational Resource under a CC-BY-SA license, without using proprietary content or third-party software.
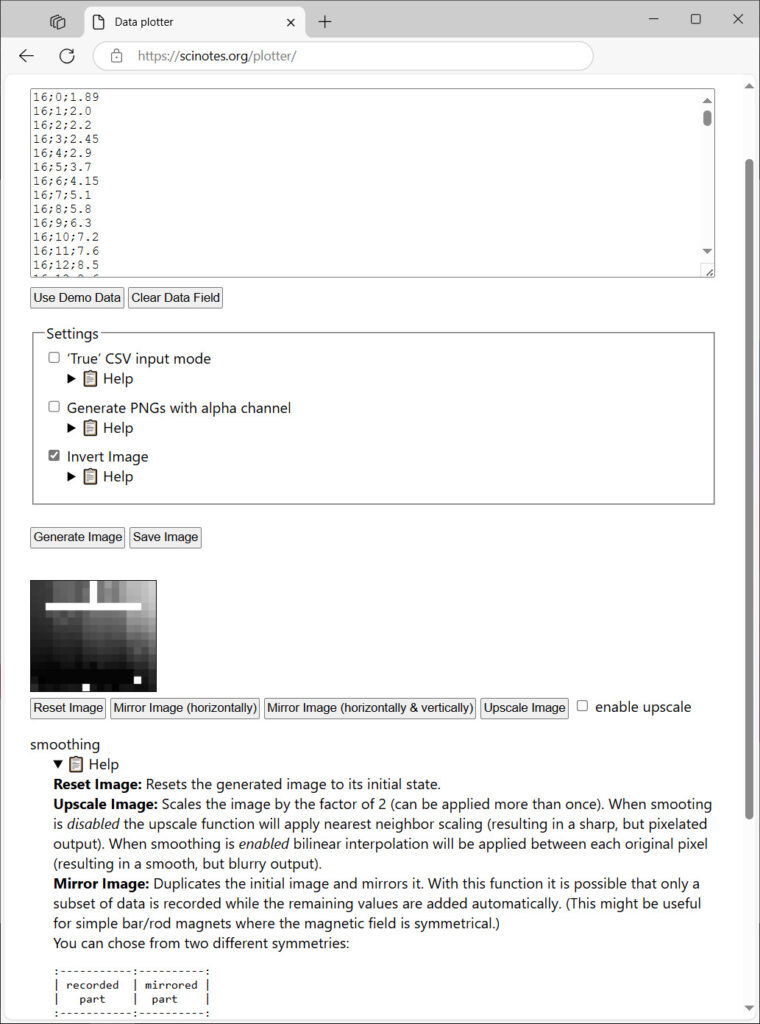
Teachers’ Limited Time: To minimize the need for training and allow immediate experimentation, demo data is embedded in the document and can be accessed with the click of a button.
Robust Data Entry: Given that students will manually collect and record data, input errors are likely. Solution: Strong sanitizing of inputs using regular expressions. The tool offers two data input methods: (1) using the comma as a decimal separator (as students are taught), and (2) importing classical CSVs using a period as a decimal separator. Any headers are automatically ignored.
Different Assumptions About the Origin: The data may assume varying positions for the origin point, either at the bottom-left corner or at the center of the measured object. Solution: The tool largely autonomously determines the origin through heuristics.
Short Class Periods: To make the most of limited class time, the tool incorporates as many functions as possible, even those that might be achievable through alternative means. Solution: The tool provides features like mirroring to optimize data entry for simple or multiple symmetry axes of the measured fields. Additionally, the generated image can be upscaled using either nearest neighbor or bilinear interpolation.
Handling Different Data Volumes: Student experiments typically involve a maximum of 300 measurements, while existing datasets (e.g., from research labs) can contain over 25,000 individual measurements.
Automatic Calibration of Dynamic Range: Depending on the experiment, measured values might range from small decimals to mid-double-digit numbers. Solution: The tool automatically determines the dynamic range and maps it appropriately onto the 256 levels of an 8-bit PNG image.
Outcomes
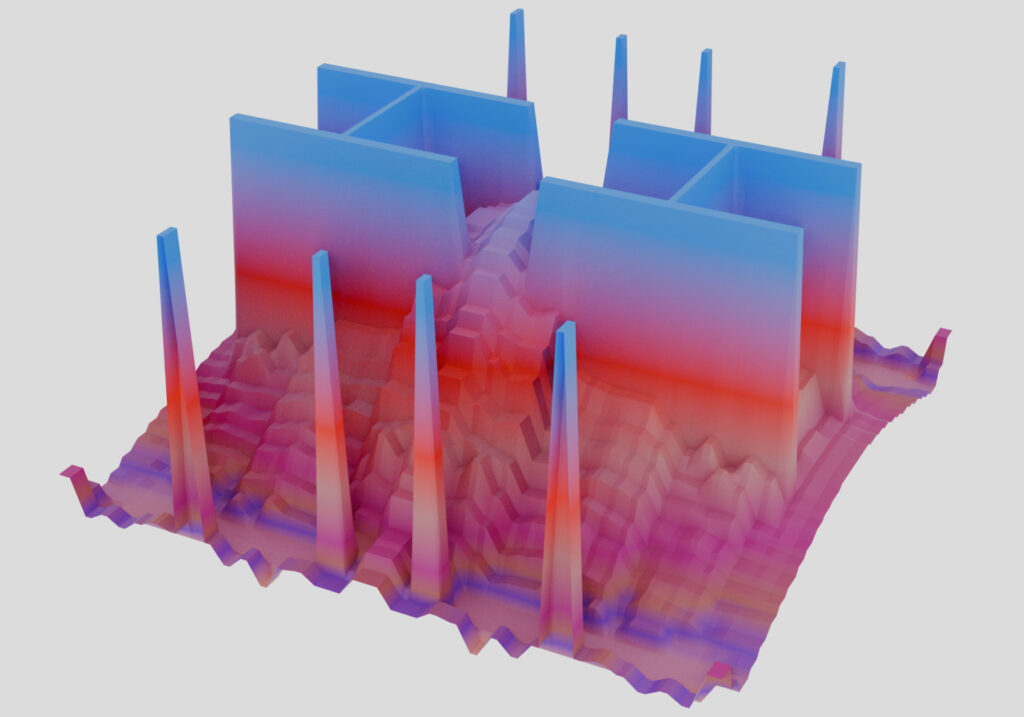
The primary goal of this tool is to make invisible phenomena, such as magnetic fields, visually perceptible and “tangible.” The images produced by the tool serve as displacement maps to convert the data into a mesh within a 3D software program like Blender. In the future, these 3D models are intended not merely as visual aids but as 3D prints that provide a genuine tactile experience.
Open Source and Future Use
The tool can be freely used as an Open Educational Resource, and experimentation is explicitly encouraged. Link to the tool: https://scinotes.org/plotter/
Full disclosure
The project builds upon an initial idea from LMU Munich, which had a similar plotter available on their website (archive.org-Link). However, since that project is currently (as of October 2024) no longer functional, we decided to undertake our own (further) development. Our tool is still compatible with the measurement data from the LMU project if the option true CSV import is selected.